
SOP Title-Dissolution Profile Comparison
- OBJECTIVE
To lay down a procedure for preparation of dissolution profile comparison protocol.
- SCOPE
This SOP is applicable for dissolution profile comparison in quality control department.
3.0 RESPONSIBILITY
- QC Executive – To follow the SOP.
- QC Head – Review, technical correction, training and monitoring of SOP.
- QA Head – Approval and implementation of SOP.
- PROCEDURE
- Dissolution profile comparison protocol shall be prepared and numbering shall be as follows;
QC/DPC/XX/YY
QC is the Quality Control
DPC is the Dissolution Profile Comparison
XX is the sequential number of Protocol
YY is the calendar year
- The list of dissolution profile protocol shall be prepare as per define format.
- The dissolution profile protocol shall be prepared as per SOP.
- The dissolution profile protocol shall contain the following parameters;
- Dissolution profile comparison protocol cover page
- Protocol approval
- Revision History
- Objective
- Scope
- Responsibility
- Procedure
- Calculation for (f1) & (f2)
- Acceptance Criteria
- Maintenance of raw data
- Deviation (if Any)
- Reference
- Procedure: Perform 12 dosage units dissolution as per analytical standard test procedure for test product and RLD sample.
- Calculation : Calculate the difference factor (f1) & similarity factor (f2)
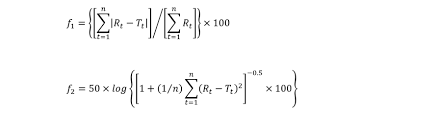
Where,
n = Number of Dissolution time points
Rt and Tt are the cumulative percentage of the drug dissolved at each of the selected n time points of the reference and test product, respectively.
- An aqueous medium with pH range 1.2 to 6.8 (ionic strength of buffers the same as in USP) should be used. To simulate intestinal fluid (SIF), a dissolution medium of pH 6.8 should be employed. A higher pH should be justified on a case-by-case basis and in general, should not exceed pH 8.0. To simulate gastric fluid (SGF), a dissolution medium of pH 1.2 should be employed without enzymes. The need for enzymes in SGF and SIF should be evaluated on a case-by-case basis and should be justified.
The dissolution time points for both the profiles shall the same (e.g. 15, 30, 45, 60 minutes). The reference batch used shall be the most recently manufactured product.
- To allow use of mean data, the percent coefficient of variation at the earlier time points (e.g., 15 minutes) shall not be more than 20%, and at other time points should not be more than 10%
- In case release % is more than 85% for intermediate release dosages forms. Then similarity factor & difference factor is not required.
- Acceptance criteria:
For curves to be considered similar, f1 values should be upto 15 (0-15), and f2 values should be greater than 50 (50-100)..
- Additionally, All calculation for comparison data and graphical presentation of dissolution profile shall be prepared in additional sheet as a supporting data. (If required).
- ABBREVIATION(s)
| Abbreviation | Full Description |
| SOP | Standard Operating Procedure |
| QA | Quality Assurance |
| QC | Quality Control |
| ARD | Analytical Research Department |
| RLD | Reference Listed Drug |
| FDA | Food and Drug Administration |
| USP | United States Pharmacopeia |
| SIF | Simulate Intestinal Fluid |
| SGF | Simulate Gastric Fluid |
*Note – Ready to use SOP available in “DOWNLOAD” Section.